/prod01/wlvacuk/media/departments/digital-content-and-communications/images-2024/Diane-Spencer-(Teaser-image).jpg)
/prod01/wlvacuk/media/departments/digital-content-and-communications/images-18-19/220325-Engineers_teach_thumbail.jpg)
/prod01/wlvacuk/media/departments/digital-content-and-communications/images-2024/241024-Dr-Christopher-Stone-Resized.jpg)
/prod01/wlvacuk/media/departments/digital-content-and-communications/images-2024/241014-Cyber4ME-Project-Resized.jpg)
/prod01/wlvacuk/media/departments/digital-content-and-communications/images-2024/240315-Research-Resized.jpg)
/prod01/wlvacuk/media/departments/digital-content-and-communications/images-18-19/210722-Ambika-Paul-Resized.jpg)
Using bibliometric and altmetric tools
Once your research has been published you may be curious to know how widely read and cited it is to build a picture of how others are engaging with it.
In this post we’ll be taking a look at some of the tools for quantitatively measuring the impact of your publications. As there are so many tools (and some require subscriptions to access) we’ll be focusing on several methods for assessing individual publications that are accessible to researchers at the university without cost. Journal-based bibliometrics (e.g. journal impact factors) are quite contentious and are a topic for discussion at another time!
Being careful with ‘metrics’
Before we look at the tools, it’s worth proceeding with a few cautionary words on the use of bibliometric indicators (often referred to as ‘metrics’).
These indicators can certainly be useful to researchers- the university’s Research Indicators (metrics) policy encourages researchers to monitor bibliometric indicators for “self-evaluation purposes” to give an idea of who is accessing your research which can also be an aid to deciding on future publishing topics or strategies.
Beyond this, the usefulness of indicators as a measure of research impact is subject to debate and there is concern that when it comes to assessing research quality, if not viewed critically, they may potentially do more harm than good. The San Francisco Declaration on Research Assessment (DORA) which the university is signatory to, makes a number of recommendations such as avoiding the use of journal-based metrics (journal impact factors) when assessing the quality of research in hiring, promotion or funding decisions, and assessing research papers based on their content and other measures including qualitative measures of impact.
When using bibliometric tools make sure you handle them with care as results can be deceptive if they are not viewed critically. We’ve outlined a few caveats below to bear in mind when interpreting results.
Tracking citations for individual articles
Citation information for publications can be found using either Scopus or Web of Science. The university library has a subscription to both databases which can be accessed via the library webpages: https://www.wlv.ac.uk/lib/resources/databases-a-z/
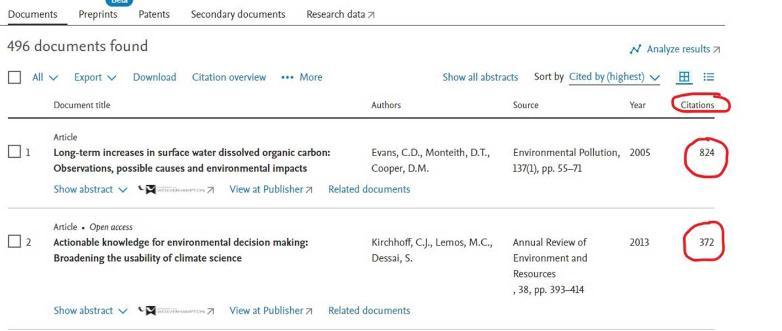
Both databases track the number of times a publication has been cited by other articles however, as they use different data sources, neither provides a full account of the total citations for a given publication. A more accurate result can be obtained by combining the citation counts from both databases and removing duplicate citations from the results. The screenshot displayed here shows citation counts in Scopus.
Resources on using Scopus can be found here and similar resources on using Web of Science can be found here.
Google Scholar also provides citation counts for publications which can be a lot higher than those from either Scopus or Web of Science. Again this is down to the sources that Google Scholar draws upon which include monographs, theses and grey literature.
It’s important to be aware that citation counts are just that- the number of times a paper has been cited. They don’t provide details of how the citations engage with the article or indicate the quality of the article (papers that have been retracted or discredited may be highly cited but not for the right reasons!) There isn’t a single tool that provides a definitive number of citations- as each draws upon different sources and produces different results, the results can only be seen as partial and subjective. Be aware that citation counts may include self-citations, so if possible discount self-citations from your results (Scopus provides an option to do this).
Altmetrics
Another form of article level metrics are alternative metrics (‘altmetrics’) which indicate how research is being engaged with in non-academic settings. Altmetrics measure online attention gained by research publications through social media, policy documents and news coverage. As well as being a useful way of demonstrating research impact outside of academia, altmetrics can provide an early indication of impact since feedback via social media is much quicker to obtain than citations in journal articles.
This video provides a helpful introduction to altmetrics: https://www.youtube.com/watch?v=M6XawJ7-880
Plum Metrics is an altmetrics tool that researchers can access via our subscription to Scopus. In Scopus, search for an article and scroll down to the metrics. Below the Scopus metrics you will see the Plum Metrics displayed.
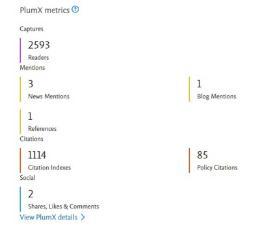
If you click on ‘view Plum X details’ you can see the results in more detail and can click through to see the various policy citations, news and blog mentions, and Wikipedia references for the publication. The ‘Plum print’ visualisation provides a multicoloured representation of the different elements: usage (green), captures (purple), mentions (yellow), social media (blue) and citations (red). You can read more about what these categories cover here: https://service.elsevier.com/app/answers/detail/a_id/12031/supporthub/scopus/#plumx
Altmetric is another source of altmetrics which provides similar data such as news outlets where a paper has been referenced and where it has been posted on social media. If you have an Elements profile the Altmetric badge will be displayed under the Metrics heading for research papers in your publications list. You’ll also see the Altmetric badge on records for publications deposited in WIRE.
Like citation counts, altmetrics may indicate the potential reach of a publication but they cannot conclusively demonstrate the value of research nor its impact. As they have been found to be open to gaming and artificial bias, altmetrics should be interpreted with care particularly in respect of research assessment (see this article by Mike Thelwall on the pros and cons of the use of altmetrics for this purpose).
IRUS for WIRE page views and downloads
If you have deposited publications in WIRE you may want to track levels of engagement via the repository. It is possible to see the number of page views and downloads for individual publications deposited in WIRE. At the moment this data isn’t displayed within WIRE itself due to some technical issues which should be resolved once the repository is updated later this year.
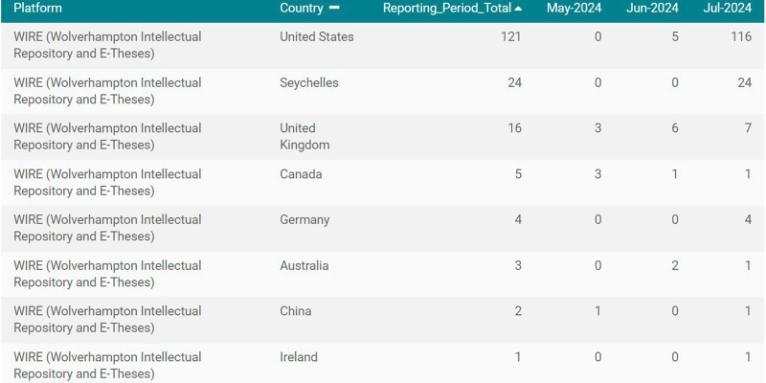
In the meantime researchers can use IRUS to access the information. IRUS provides usage statistics for institutional repositories and the scholarly communications team uses the data to provide faculties with monthly WIRE reports. Individual item reports can be created in IRUS for each publication deposited in WIRE. You can view the number of page views (“investigations”) and downloads (“requests”) and it is possible to view a breakdown of this data by country so you can see where in the world users have been accessing your research publication. The screenshot below shows IRUS data on the number downloads by country for a publication in WIRE.
To create a report for your publication you’ll need the DOI or the IRUS ID. If your publication doesn’t have a DOI (e.g. theses or working papers) then you’ll need the IRUS ID. Please contact the scholarly communications team if you would like to know what the IRUS ID for your item is.
So that’s a flavour of how to track engagement with your research publications using some of the tools available through the university. Give them a try and see what you can find out about your research. Remember to use them responsibly!
Sarah Dar, Scholarly Communications Officer
Further resources
For more information on bibliometric indicators and impact, take a look at the Raising Your Research Impact guide which can be found here: https://www.wlv.ac.uk/lib/research/guides-for-researchers/
You can read more about the issues with indicators in research assessment in the Metric Tide report.
Photo by Niko Nieminen on Unsplash
For more information please contact the Corporate Communications Team.